Exploring Kafka Cruise Control
A hands-on introduction to Kafka Cruise Control, showing how to set it up, observe a real imbalance, trigger a rebalance, and explore the core ideas behind how Cruise Control collects metrics and makes optimization decisions.
Managing large, ever-evolving Kafka clusters can be challenging because they quickly become unbalanced. A growing cluster doesn’t balance itself: new brokers can sit idle while existing ones melt under heavy load. Cruise Control is LinkedIn’s answer to this problem: a system that constantly watches the cluster, keeps load evenly distributed, and automatically heals when brokers are added or fail.
I played with Cruise Control and wanted to share some notes. This post starts with a simple minimal example that runs a kafka cluster locally, creates a unbalanced load that gets adjusted by Cruise Control. Afterwords, we explore some parts of the codebase (only a tiny subset) to get a taste of its internals.
A Simple Quickstart Example
Let’s clone the Cruise Control repo and build the JARs:
1
2
3
git clone https://github.com/linkedin/cruise-control.git && cd cruise-control

./gradlew jar
This will build the Cruise Control Reporter jar used by brokers to push metrics and the other jars used by Cruise Control.
We’re going to use Docker to start a 2-node Kafka cluster. However, we first need to configure CruiseControlMetricsReporter as one of our cluster’s metric.reporters. A metric reporter is notified of all Kafka metrics and can do with them as it pleases. In the case of Cruise Control, it listens for the metrics it’s interested in and publishes them to a topic named __CruiseControlMetrics.
How are these metrics determined? It just so happens that there is a function called isInterested (what a coincidence!) that evaluates whether a metric is relevant. The list of metrics includes bytes in and out per second, partition size, replication, queue size, etc.
Here are the Docker commands to start the cluster with Cruise Control as a metric reporter. Notice we’re mounting the built metric reporter JAR (./cruise-control-metrics-reporter/build/libs/cruise-control-metrics-reporter-2.5.147-SNAPSHOT.jar) into Kafka’s libs directory so it’s available on the classpath.
1
2
3
4
5
6
7
8
9
10
11
12
13
14
15
16
17
18
19
20
21
22
23
24
25
26
27
28
29
30
31
32
33
34
35
36
37
38
39
docker network create kafka-net
docker run -d \
  --name kafka \
  --network kafka-net \
  -p 9092:9092 \
  -v ./cruise-control-metrics-reporter/build/libs/cruise-control-metrics-reporter-2.5.147-SNAPSHOT.jar:/opt/kafka/libs/cruise-control-metrics-reporter-2.5.147-SNAPSHOT.jar \
  -e CLUSTER_ID=KzCef4BOFEGGW9AKEASTER \
  -e KAFKA_OFFSETS_TOPIC_REPLICATION_FACTOR=1 \
  -e KAFKA_TRANSACTION_STATE_LOG_REPLICATION_FACTOR=1 \
  -e KAFKA_TRANSACTION_STATE_LOG_MIN_ISR=1 \
  -e KAFKA_NODE_ID=1 \
  -e KAFKA_PROCESS_ROLES=broker,controller \
  -e KAFKA_CONTROLLER_QUORUM_VOTERS=1@kafka:9999,2@kafka2:9999 \
  -e KAFKA_LISTENER_SECURITY_PROTOCOL_MAP=PLAINTEXT:PLAINTEXT,PLAINTEXT_HOST:PLAINTEXT,CONTROLLER:PLAINTEXT \
  -e KAFKA_LISTENERS=PLAINTEXT://0.0.0.0:29092,PLAINTEXT_HOST://0.0.0.0:9092,CONTROLLER://0.0.0.0:9999 \
  -e KAFKA_ADVERTISED_LISTENERS=PLAINTEXT://kafka:29092,PLAINTEXT_HOST://localhost:9092 \
  -e KAFKA_CONTROLLER_LISTENER_NAMES=CONTROLLER \
  -e KAFKA_INTER_BROKER_LISTENER_NAME=PLAINTEXT \
  -e KAFKA_METRIC_REPORTERS=com.linkedin.kafka.cruisecontrol.metricsreporter.CruiseControlMetricsReporter \
  -e KAFKA_CRUISE_CONTROL_METRICS_REPORTER_BOOTSTRAP_SERVERS=kafka:29092,kafka2:29093 \
  apache/kafka:4.1.1

docker run -d \
  --name kafka2 \
  --network kafka-net \
  -p 9093:9093 \
  -v ./cruise-control-metrics-reporter/build/libs/cruise-control-metrics-reporter-2.5.147-SNAPSHOT.jar:/opt/kafka/libs/cruise-control-metrics-reporter-2.5.147-SNAPSHOT.jar \
  -e CLUSTER_ID=KzCef4BOFEGGW9AKEASTER \
  -e KAFKA_NODE_ID=2 \
  -e KAFKA_PROCESS_ROLES=broker,controller \
  -e KAFKA_CONTROLLER_QUORUM_VOTERS=1@kafka:9999,2@kafka2:9999 \
  -e KAFKA_LISTENER_SECURITY_PROTOCOL_MAP=PLAINTEXT:PLAINTEXT,PLAINTEXT_HOST:PLAINTEXT,CONTROLLER:PLAINTEXT \
  -e KAFKA_LISTENERS=PLAINTEXT://0.0.0.0:29093,PLAINTEXT_HOST://0.0.0.0:9093,CONTROLLER://0.0.0.0:9999 \
  -e KAFKA_ADVERTISED_LISTENERS=PLAINTEXT://kafka2:29093,PLAINTEXT_HOST://localhost:9093 \
  -e KAFKA_CONTROLLER_LISTENER_NAMES=CONTROLLER \
  -e KAFKA_INTER_BROKER_LISTENER_NAME=PLAINTEXT \
  -e KAFKA_METRIC_REPORTERS=com.linkedin.kafka.cruisecontrol.metricsreporter.CruiseControlMetricsReporter \
  -e KAFKA_CRUISE_CONTROL_METRICS_REPORTER_BOOTSTRAP_SERVERS=kafka:29092,kafka2:29093 \
  apache/kafka:4.1.1
At this point, we have a cluster that’s collecting metrics and sending them to the __CruiseControlMetrics topic.
1
2
3
docker exec kafka /opt/kafka/bin/kafka-topics.sh \
  --describe \
  --bootstrap-server kafka:29092,kafka2:29093
1
2
Topic: __CruiseControlMetrics   TopicId: W6TDGWdOQhWR43OOw9tF-g PartitionCount: 1       ReplicationFactor: 1    Configs: min.insync.replicas=1
        Topic: __CruiseControlMetrics   Partition: 0    Leader: 1       Replicas: 1     Isr: 1  Elr:    LastKnownElr:
We still don’t have Cruise Control itself running. It’s a separate component that consumes the metrics pushed by the reporter. We’ll start it from the cloned repo, but first we need to configure a few things.
First, we need to tell Cruise Control about our cluster. We’ll modify ./config/capacity.json:
1
2
3
4
5
6
7
8
9
10
11
12
13
14
{
  "brokerCapacities": [
    {
      "brokerId": "-1",
      "capacity": {
        "DISK": "1000",
        "CPU": "100",
        "NW_IN": "10000",
        "NW_OUT": "10000"
      },
      "doc": "This is the default capacity. Capacity unit used for disk is in MB, cpu is in percentage, network throughput is in KB."
    }
  ]
}
Next, set capacity.config.file to config/capacity.json. It defaults to config/capacityJBOD.json, so let’s replace it:
1
sed -i '' 's|config/capacityJBOD\.json|config/capacity.json|g' config/cruisecontrol.properties
We’ll keep only the default broker capacity and set the disk to 1000 MB. This is sufficient for our testing. Cruise Control will assume that each broker has this capacity. Cruise Control also provides an interface to populate these values dynamically via BrokerCapacityConfigResolver, but that’s a topic for another day.
Our goal is the following: create three topics, each with one partition and one replica. By definition, one broker will host two replicas and the other just one. We’ll then produce enough data to the two replicas on the same broker so that it exceeds the tolerated threshold.
By default, the DiskCapacityGoal ensures that disk usage stays below a certain threshold. The default value of disk.capacity.threshold is 0.8. So if we fill the first broker up to around 900 MB (each replica ~450 MB), this goal should be violated, and moving one of the replicas to the other broker should fix the problem. Cruise Control should be able to do this automatically.
Another default goal is RackAwareGoal. For our purposes, let’s remove it:
1
2
# remove 'com.linkedin.kafka.cruisecontrol.analyzer.goals.RackAwareGoal,' from the config file
sed -i '' 's/com\.linkedin\.kafka\.cruisecontrol\.analyzer\.goals\.RackAwareGoal,//g' config/cruisecontrol.properties
Cruise Control’s bootstrap.servers defaults to localhost:9092. Our Dockerized Kafka exposed ports and advertised listeners should work fine.
Now let’s start Cruise Control. This will start the service and expose a web API on port 9090. It will read metrics from the __CruiseControlMetrics topic, build an understanding of the current cluster usage, and evaluate whether the configured goals (disk, CPU, network balance, replica placement, leader balance, etc.) are satisfied.
1
./kafka-cruise-control-start.sh config/cruisecontrol.properties 9090
If everything goes well, you should see a lot of logs and something like:
1
2
3
4
5
6
7
8
9
>> ********************************************* <<
>> Application directory            : /path/to/cruise-control
>> REST API available on            : /kafkacruisecontrol/*
>> Web UI available on              : /*
>> Web UI Directory                 : ./cruise-control-ui/dist/
>> Cookie prefix path               : /
>> Kafka Cruise Control started on  : http://0.0.0.0:9090/
>> CORS Enabled ?                   : false
>> Vertx Enabled ?                  : false
If you access http://localhost:9090/kafkacruisecontrol/state in your browser, you should see something like:
1
2
3
4
MonitorState: {state: RUNNING(0.000% trained), NumValidWindows: (0/0) (NaN%), NumValidPartitions: 0/0 (0.000%), flawedPartitions: 0}
ExecutorState: {state: NO_TASK_IN_PROGRESS}
AnalyzerState: {isProposalReady: false, readyGoals: []}
AnomalyDetectorState: {selfHealingEnabled:[], selfHealingDisabled:[BROKER_FAILURE, DISK_FAILURE, GOAL_VIOLATION, METRIC_ANOMALY, TOPIC_ANOMALY, MAINTENANCE_EVENT], selfHealingEnabledRatio:{BROKER_FAILURE=0.0, DISK_FAILURE=0.0, GOAL_VIOLATION=0.0, METRIC_ANOMALY=0.0, TOPIC_ANOMALY=0.0, MAINTENANCE_EVENT=0.0}, recentGoalViolations:[], recentBrokerFailures:[], recentMetricAnomalies:[], recentDiskFailures:[], recentTopicAnomalies:[], recentMaintenanceEvents:[], metrics:{meanTimeBetweenAnomalies:{GOAL_VIOLATION:0.00 milliseconds, BROKER_FAILURE:0.00 milliseconds, METRIC_ANOMALY:0.00 milliseconds, DISK_FAILURE:0.00 milliseconds, TOPIC_ANOMALY:0.00 milliseconds}, meanTimeToStartFix:0.00 milliseconds, numSelfHealingStarted:0, numSelfHealingFailedToStart:0, ongoingAnomalyDuration=0.00 milliseconds}, ongoingSelfHealingAnomaly:None, balancednessScore:100.000}
Cruise Control also has a UI. It works simply by being made available in the Web UI directory (./cruise-control-ui/dist/).
Let’s grab it:
1
2
3
4
pwd
# /path/to/cruise-control  <<<<< MUST be inside the cloned cruise-control repo
curl -L -O https://github.com/linkedin/cruise-control-ui/releases/download/v0.4.0/cruise-control-ui-0.4.0.tar.gz
tar zxvf cruise-control-ui-*.tar.gz
1
2
3
4
5
6
7
8
9
10
11
tree -L 1
.
.
.
├── cruise-control-client
├── cruise-control-core
├── cruise-control-metrics-reporter
├── cruise-control-ui   <<<<<<<<<<<<<<<<<<<<<<<<<<<< extracted UI folder
.
.
.
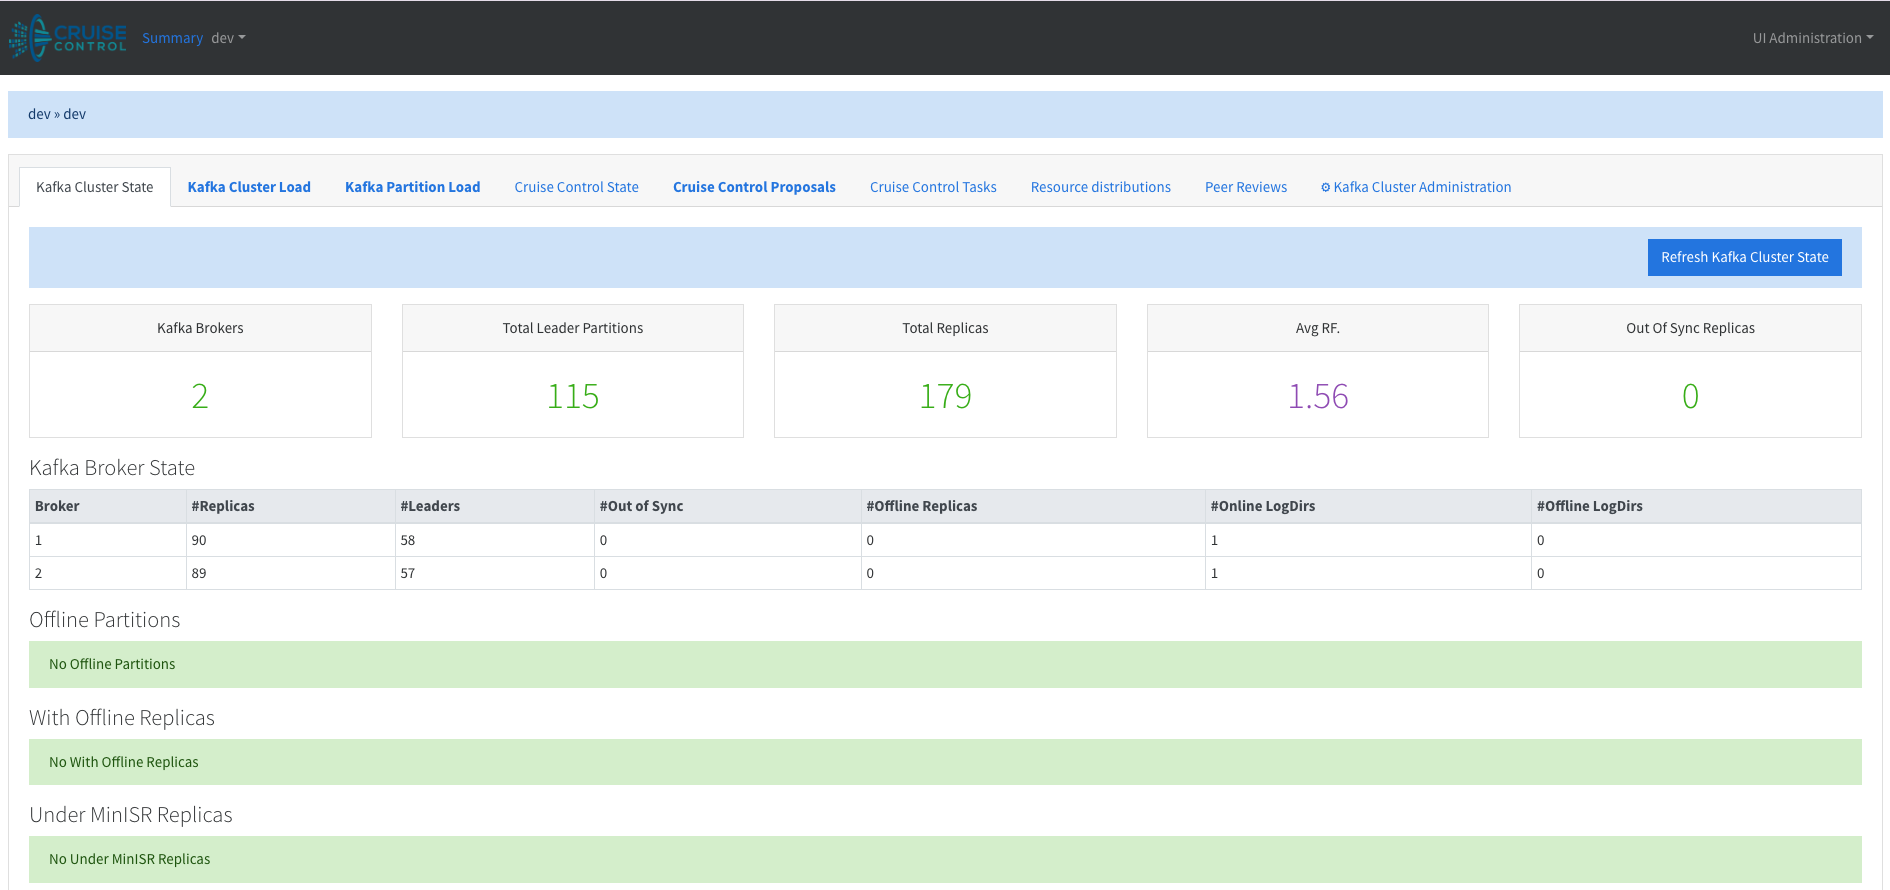
If you go to http://localhost:9090/#/dev/dev/kafka_cluster_state, you’ll see a nice UI. (You may need to stop and restart Cruise Control for the UI to be picked up.)
Now for the fun part. Let’s create an unbalanced situation and see if Cruise Control can restore order.
1
2
3
4
5
6
7
8
9
10
11
12
13
14
15
for i in 1 2 3; do
  docker exec kafka /opt/kafka/bin/kafka-topics.sh \
    --create \
    --topic topic-$i \
    --bootstrap-server kafka:29092,kafka2:29093 \
    --partitions 1 \
    --replication-factor 1
done

for i in 1 2 3; do
  docker exec kafka /opt/kafka/bin/kafka-topics.sh \
    --describe \
    --topic topic-$i \
    --bootstrap-server kafka:29092,kafka2:29093
done
1
2
3
4
5
6
7
8
9
Created topic topic-1.
Created topic topic-2.
Created topic topic-3.
Topic: topic-1	TopicId: Zg9AaXsJRJOTbJfpIj9p4g	PartitionCount: 1	ReplicationFactor: 1	Configs: min.insync.replicas=1
	Topic: topic-1	Partition: 0	Leader: 1	Replicas: 1	Isr: 1	Elr: 	LastKnownElr:
Topic: topic-2	TopicId: oxvozsaRQJi0SF92QmoBGw	PartitionCount: 1	ReplicationFactor: 1	Configs: min.insync.replicas=1
	Topic: topic-2	Partition: 0	Leader: 1	Replicas: 1	Isr: 1	Elr: 	LastKnownElr:
Topic: topic-3	TopicId: GAIGBge_Qw2fcgP7_iQjPQ	PartitionCount: 1	ReplicationFactor: 1	Configs: min.insync.replicas=1
	Topic: topic-3	Partition: 0	Leader: 2	Replicas: 2	Isr: 2	Elr: 	LastKnownElr:
topic-1 and topic-2 are both on broker 1. Let’s fill them with about 450 MB of data each and see what happens.
1
2
3
4
5
6
7
8
9
10
11
12
# use yes to produce an infinite stream, then head -c to limit bytes
yes "xxxxxxxxxxxxxxxxxxxxxxxxxxxxxxxxxxxxxxxxxxxxxxxxxx" | \
head -c 450000000 | \
docker exec -i kafka /opt/kafka/bin/kafka-console-producer.sh \
  --bootstrap-server kafka:29092,kafka2:29093 \
  --topic topic-1

yes "xxxxxxxxxxxxxxxxxxxxxxxxxxxxxxxxxxxxxxxxxxxxxxxxxx" | \
head -c 450000000 | \
docker exec -i kafka /opt/kafka/bin/kafka-console-producer.sh \
  --bootstrap-server kafka:29092,kafka2:29093 \
  --topic topic-2
Kafka data is stored in log.dir, which defaults to /tmp/kafka-logs.
Let’s make sure things look right:
1
2
3
4
5
docker exec -it kafka du -h -d0 /tmp/kafka-logs/
# 979M	/tmp/kafka-logs/

docker exec -it kafka2 du -h -d0 /tmp/kafka-logs/
# 1.4M	/tmp/kafka-logs/
So broker 1 is clearly violating the DiskCapacityGoal.
If we wait a couple of minutes and check the logs, we’ll find:
1
WARN GOAL_VIOLATION detected {Unfixable goal violations: {}, Fixable goal violations: {DiskCapacityGoal}, Exclude brokers recently (removed: true demoted: true), Provision: UNDECIDED}. Self healing is disabled. (com.linkedin.kafka.cruisecontrol.detector.notifier.SelfHealingNotifier)
Nice! Cruise Control detected the problem. However, self-healing is disabled by default, so it won’t take action automatically. We can either set self.healing.enabled=true in cruisecontrol.properties or trigger a rebalance manually.
Let’s first check the UI. Under the Kafka Cluster tab:
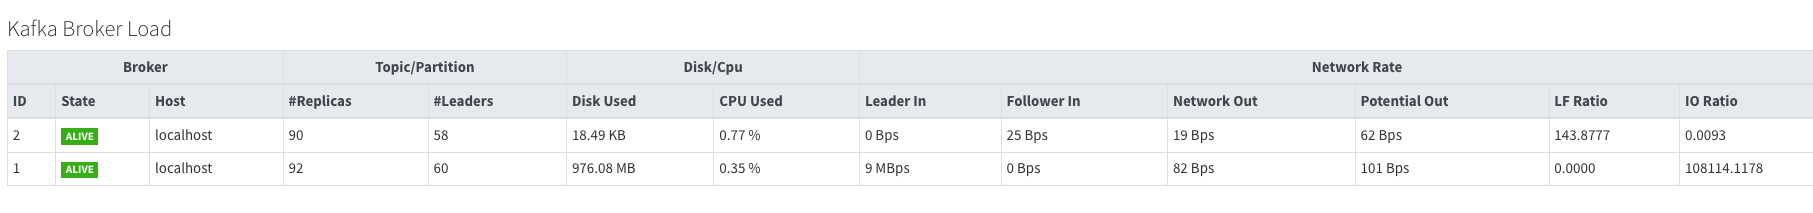
We can see around 976MB of disk usage.
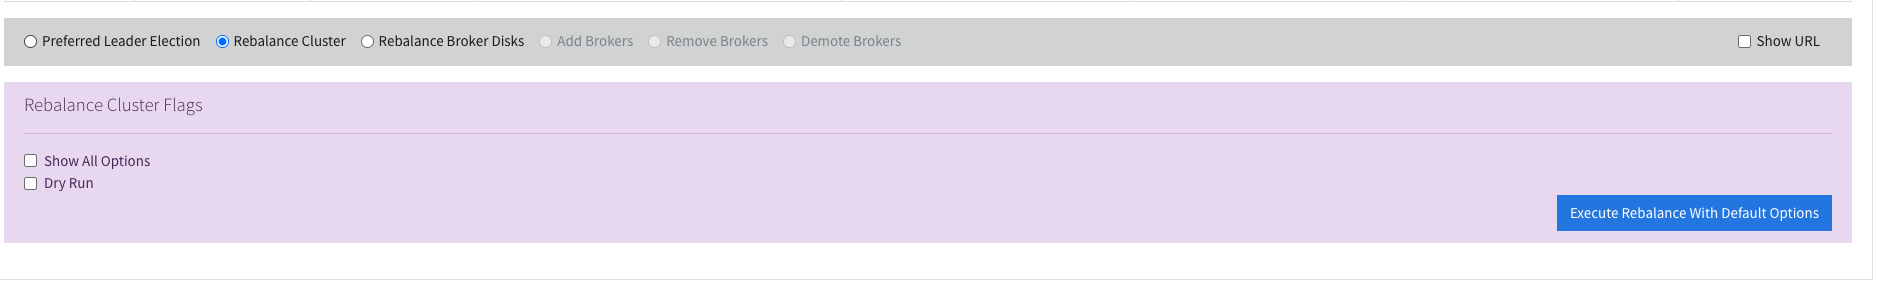
We can trigger a rebalance using the API:
1
POST /kafkacruisecontrol/rebalance
Or via the UI (which simply calls the API for us) under Kafka Cluster Administration:
After triggering the rebalance, the logs show:
1
2
3
4
5
INFO [0:0:0:0:0:0:0:1] - - [27/Dec/2025:04:44:18 +0000] "POST /kafkacruisecontrol/rebalance?dryrun=false&json=true HTTP/1.1" 200 16128 (CruiseControlPublicAccessLogger)
...
INFO User task 18ec43e0-d531-4815-82e8-bb1d834a23c0: 7/7 (100.00%) inter-broker partition movements completed. 487/487 (100.00%) MB have been moved.
...
INFO User task 18ec43e0-d531-4815-82e8-bb1d834a23c0: 7/7 (100%) leadership movements completed.
If we now check the cluster load, we see a nicely balanced ~480 MB on both brokers. To double-check on disk:
1
2
3
4
5
docker exec -it kafka du -h -d0 /tmp/kafka-logs/
# 491M	/tmp/kafka-logs/

docker exec -it kafka2 du -h -d0 /tmp/kafka-logs/
# 490M	/tmp/kafka-logs/
Nice. With self-healing enabled, we wouldn’t even have had to trigger the rebalance manually. What we demonstrated here is a very simple goal, but there’s a long list of available goals, and you can even implement your own.
Code Exploration
Producing the Metrics
CruiseControlMetricsReporter implements the MetricsReporter interface, which is required by any reporter listed in metric.reporters. As such, it has access to all KafkaMetric instances.
Kafka likes to keep things simple, so of course there’s a completely different metrics system. On the broker side, metrics are managed using Yammer Metrics, while clients use KafkaMetric. Fun fact: Yammer manages metrics internally and doesn’t expose them directly. In Kafka, a JMX reporter is always started when the singleton Yammer registry is created. That’s why broker metrics are always exposed via JMX, even if you use a custom reporter.
The Cruise Control reporter also receives the YammerRegistry. That registry’s package has evolved over time, and Cruise Control handles this gracefully using some clever Java reflection.
The reporter is a Runnable with an infinite loop (until shutdown) that runs every metrics.reporting.interval.ms (which defaults to 1 minute in the code):
1
2
3
4
5
6
7
8
9
10
11
12
13
14
15
16
17
while (!_shutdown) {
  long now = System.currentTimeMillis();
  LOG.debug("Reporting metrics for time {}.", now);
  try {
    if (now > _lastReportingTime + _reportingIntervalMs) {
      _numMetricSendFailure = 0;
      _lastReportingTime = now;
      reportYammerMetrics(now);
      reportKafkaMetrics(now);
      reportCpuUtils(now);
    }
    // ..
    // sleep
    Thread.sleep(nextReportTime - now);
    // ..
  }
}
We iterate over three sources of metrics: Yammer metrics, Kafka metrics, and CPU usage.
Since the reporter runs inside the broker, it can retrieve the broker’s CPU usage by calling ManagementFactory.getOperatingSystemMXBean().getProcessCpuLoad(). Interestingly, there’s a kubernetes.mode configuration that attempts to retrieve CPU usage assuming Kafka is running in Kubernetes (via cgroups). The code references a JDK issue about making OperatingSystemMXBean container-aware in older Java versions. That issue has since been resolved, so the Kubernetes mode may now be obsolete.
Incidentally, I’ve seen something similar with GOMAXPROCS (TL;DR: Go used to spawn as many threads as there were host CPU cores, even in containerized environments, but now it respects container CPU limits).
Each of the three report* functions ultimately calls sendCruiseControlMetric:
1
2
3
4
5
6
7
public void sendCruiseControlMetric(CruiseControlMetric ccm) {
  // ...
  ProducerRecord<String, CruiseControlMetric> producerRecord =
      new ProducerRecord<>(_cruiseControlMetricsTopic, null, ccm.time(), key, ccm);
  LOG.debug("Sending Cruise Control metric {}.", ccm);
  _producer.send(producerRecord, callback);
}
A POPO: a plain old producer object. Cruise Control uses its own serde, MetricSerde.
Cruise Control Core
Cruise Control starts up as follows:
1
2
3
4
5
6
7
public void startUp() {
  LOG.info("Starting Kafka Cruise Control...");
  _loadMonitor.startUp();
  _anomalyDetectorManager.startDetection();
  _goalOptimizerExecutor.execute(_goalOptimizer);
  LOG.info("Kafka Cruise Control started.");
}
The loadMonitor is responsible for tracking cluster usage. It periodically consumes the metrics topic and processes those metrics into a digestible format that can be reasoned about.
The GoalOptimizer runs continuously to compute optimization proposals and cache them. When an anomaly is detected or a user triggers a rebalance, one of these proposals is executed.
Consuming the Metrics
Metric consumption happens within Cruise Control, not within the broker, unlike what we saw in the producer section above.
The number of abstractions involved on the metrics consumption side can be a bit overwhelming. Digging around, you’ll find CruiseControlMetricsReporterSampler, which instantiates a _metricConsumer and retrieves metrics for processing:
1
2
3
4
5
6
7
8
9
10
11
12
13
14
15
16
17
18
19
20
21
22
23
24
25
26
27
28
29
30
31
32
33
34
35
36
37
38
39
40
41
42
43
44
45
46
47
48
49
50
51
52
53
54
55
56
57
58
protected int retrieveMetricsForProcessing(MetricSamplerOptions metricSamplerOptions) throws SamplingException {
  // Now seek to the startTimeMs.
  Map<TopicPartition, Long> timestampToSeek = new HashMap<>();
  for (TopicPartition tp : _currentPartitionAssignment) {
    timestampToSeek.put(tp, metricSamplerOptions.startTimeMs());
  }
  Set<TopicPartition> assignment = new HashSet<>(_currentPartitionAssignment);
  Map<TopicPartition, Long> endOffsets = _metricConsumer.endOffsets(assignment);
  Map<TopicPartition, OffsetAndTimestamp> offsetsForTimes = _metricConsumer.offsetsForTimes(timestampToSeek);
  // ...
  for (Map.Entry<TopicPartition, OffsetAndTimestamp> entry : offsetsForTimes.entrySet()) {
    TopicPartition tp = entry.getKey();
    OffsetAndTimestamp offsetAndTimestamp = entry.getValue();
    _metricConsumer.seek(tp, offsetAndTimestamp != null ? offsetAndTimestamp.offset() : endOffsets.get(tp));
  }
  SortedSet<Integer> partitionIds =
      _currentPartitionAssignment.stream().map(TopicPartition::partition).collect(Collectors.toCollection(TreeSet::new));
  LOG.debug("Starting consuming from metrics reporter topic {} for partitions {}.", _metricReporterTopic, partitionIds);
  _metricConsumer.resume(_metricConsumer.paused());
  int totalMetricsAdded = 0;
  Set<TopicPartition> partitionsToPause = new HashSet<>();
  do {
    ConsumerRecords<String, CruiseControlMetric> records =
        _metricConsumer.poll(METRIC_REPORTER_CONSUMER_POLL_TIMEOUT);
    for (ConsumerRecord<String, CruiseControlMetric> record : records) {
      if (record == null) {
        LOG.warn("Cannot parse record, please update your Cruise Control version.");
        continue;
      }
      long recordTime = record.value().time();
      if (recordTime + _acceptableMetricRecordProduceDelayMs < metricSamplerOptions.startTimeMs()) {
        LOG.debug("Discarding metric {} because its timestamp is more than {} ms earlier than the start time of sampling period {}.",
                  record.value(), _acceptableMetricRecordProduceDelayMs, metricSamplerOptions.startTimeMs());
      } else if (recordTime >= metricSamplerOptions.endTimeMs()) {
        TopicPartition tp = new TopicPartition(record.topic(), record.partition());
        LOG.debug("Saw metric {} whose timestamp is larger than the end time of sampling period {}. Pausing "
                  + "partition {} at offset {}.", record.value(), metricSamplerOptions.endTimeMs(),
                  tp, record.offset());
        partitionsToPause.add(tp);
      } else {
        addMetricForProcessing(record.value());
        totalMetricsAdded++;
      }
    }
    if (!partitionsToPause.isEmpty()) {
      _metricConsumer.pause(partitionsToPause);
      partitionsToPause.clear();
    }
  } while (!consumptionDone(_metricConsumer, endOffsets)
           && System.currentTimeMillis() < metricSamplerOptions.timeoutMs());

  LOG.info("Finished sampling from topic {} for partitions {} in time range [{},{}]. Collected {} metrics.",
           _metricReporterTopic, partitionIds,
           metricSamplerOptions.startTimeMs(), metricSamplerOptions.endTimeMs(),
           totalMetricsAdded);

  return totalMetricsAdded;
}
MetricSamplerOptions defines a startTimeMs and endTimeMs, which together describe a sampling window. The consumer seeks to the start of this window and consumes until it encounters records beyond the window, reaches the previously fetched end offsets, or hits a timeout. This puts an upper bound on how long sampling can take.
Anomaly Detector
The anomaly detector schedules several jobs at fixed intervals to check for anomalies:
1
2
3
4
5
6
7
8
9
10
11
public void startDetection() {
  scheduleDetectorAtFixedRate(GOAL_VIOLATION, _goalViolationDetector);
  scheduleDetectorAtFixedRate(METRIC_ANOMALY, _metricAnomalyDetector);
  scheduleDetectorAtFixedRate(TOPIC_ANOMALY, _topicAnomalyDetector);
  scheduleDetectorAtFixedRate(DISK_FAILURE, _diskFailureDetector);
  scheduleDetectorAtFixedRate(BROKER_FAILURE, _brokerFailureDetector);
  LOG.debug("Starting {} detector.", MAINTENANCE_EVENT);
  _detectorScheduler.execute(_maintenanceEventDetector);
  LOG.debug("Starting anomaly handler.");
  _detectorScheduler.execute(new AnomalyHandlerTask());
}
Goal Optimizer
The _goalOptimizer precomputes optimization candidates based on a ClusterModel. These proposals are later used when handling anomalies or user-triggered rebalances.
Sampled metrics are aggregated into time windows. Let’s assume each window is 5 minutes long, configured via partition.metrics.window.ms. Cruise Control keeps num.partition.metrics.windows windows (5 by default). Each incoming sample updates the aggregate value for its corresponding window, based on the sample’s timestamp.
Each window has a unique index, calculated as timeMs / _windowMs + 1. Aggregation behavior depends on the metric type:
1
2
3
4
5
6
public enum KafkaMetricDef {
  CPU_USAGE(AVG, COMMON, CPU, true),
  DISK_USAGE(LATEST, COMMON, DISK, false),
  LEADER_BYTES_IN(AVG, COMMON, NW_IN, false),
  // ...
}
For DISK_USAGE, only the LATEST value matters. For CPU_USAGE and LEADER_BYTES_IN, Cruise Control computes an average by summing values and dividing by the count. The implementation is exactly what you’d expect: sum divided by count.
Cruise Control can also perform extrapolation when there aren’t enough samples. If a window lacks sufficient samples but the windows before and after are populated, Cruise Control combines all three:
1
2
3
4
5
6
7
8
9
10
11
12
13
14
15
double total = _windowValuesByMetricId.get(metricId)[prevArrayIndex]
             + (_counts[arrayIndex] == 0 ? 0 : _windowValuesByMetricId.get(metricId)[arrayIndex])
             + _windowValuesByMetricId.get(metricId)[nextArrayIndex];
switch (info.aggregationFunction()) {
  case AVG:
    aggValuesForMetric.set(resultIndex,
        total / (_counts[prevArrayIndex] + _counts[arrayIndex] + _counts[nextArrayIndex]));
    break;
  case MAX:
  case LATEST:
    aggValuesForMetric.set(resultIndex, total / (_counts[arrayIndex] > 0 ? 3 : 2));
    break;
  default:
    throw new IllegalStateException("Should never be here.");
}
The raw windowed values are stored in RawMetricValues, which uses cyclic buffers to efficiently recycle windows as time advances.
Cluster Model
The cluster model aggregates everything Cruise Control knows about the cluster: topology, capacity, liveness, replica placement, and load. It’s populated from the capacity configuration (or a dynamic resolver) as well as metadata fetched via the AdminClient.
1
2
3
4
5
6
7
8
9
10
public class ClusterModel implements Serializable {
  // ...
  private final Map<String, Rack> _racksById;
  private final Map<Integer, Rack> _brokerIdToRack;
  private final Map<TopicPartition, Partition> _partitionsByTopicPartition;
  private final SortedSet<Broker> _brokers;
  private final double[] _clusterCapacity;
  private final Load _load;
  // ...
}
The GoalOptimizer retrieves the ClusterModel from the loadMonitor and generates optimization plans (proposals).
Capacity Goals and Proposals
Capacity-related goals include DiskCapacityGoal, CpuCapacityGoal, NetworkOutboundCapacityGoal, and NetworkInboundCapacityGoal, all of which extend CapacityGoal.
Thresholds are configured as follows:
1
2
3
4
cpu.capacity.threshold=0.7
disk.capacity.threshold=0.8
network.inbound.capacity.threshold=0.8
network.outbound.capacity.threshold=0.8
If utilization exceeds a threshold, Cruise Control attempts a BalancingAction, which has a source, a destination, and an ActionType:
1
2
3
4
5
6
7
public enum ActionType {
  INTER_BROKER_REPLICA_MOVEMENT("REPLICA"),
  INTRA_BROKER_REPLICA_MOVEMENT("INTRA_BROKER_REPLICA"),
  LEADERSHIP_MOVEMENT("LEADER"),
  INTER_BROKER_REPLICA_SWAP("SWAP"),
  INTRA_BROKER_REPLICA_SWAP("INTRA_BROKER_SWAP");
}
For capacity goals, Cruise Control may first try a leadership movement (to reduce CPU or outbound network usage). If that’s insufficient, it falls back to replica movements or swaps to adjust disk, network, or CPU utilization.
All of this runs inside a simulation: replicas have associated costs (CPU, disk, network in/out), broker load is the sum of replica loads, and each proposed move is evaluated to ensure it doesn’t violate any configured goals.
This process is implemented in AbstractGoal.optimize, which iterates over brokers until the goal is satisfied:
1
2
3
4
5
6
while (!_finished) {
  for (Broker broker : brokersToBalance(clusterModel)) {
    rebalanceForBroker(broker, clusterModel, optimizedGoals, optimizationOptions);
  }
  updateGoalState(clusterModel, optimizationOptions);
}
The optimizer runs all goals in priority order:
1
2
OptimizerResult result =
    optimizations(clusterModel, _goalsByPriority, operationProgress);
After optimization, Cruise Control computes the diff between the initial and optimized replica and leader distributions to produce a set of ExecutionProposals. These proposals are then executed (either via self-healing or a user request) by the Executor, which ultimately calls Kafka Admin APIs such as alterPartitionReassignments.
That diff is the proposal.
Conclusion
Let’s stop here, this post is starting to get a bit long. There are many clever and interesting aspects we didn’t cover, but I hope this whetted your appetite to go explore and play with Cruise Control yourself!